Loading...
Loading...
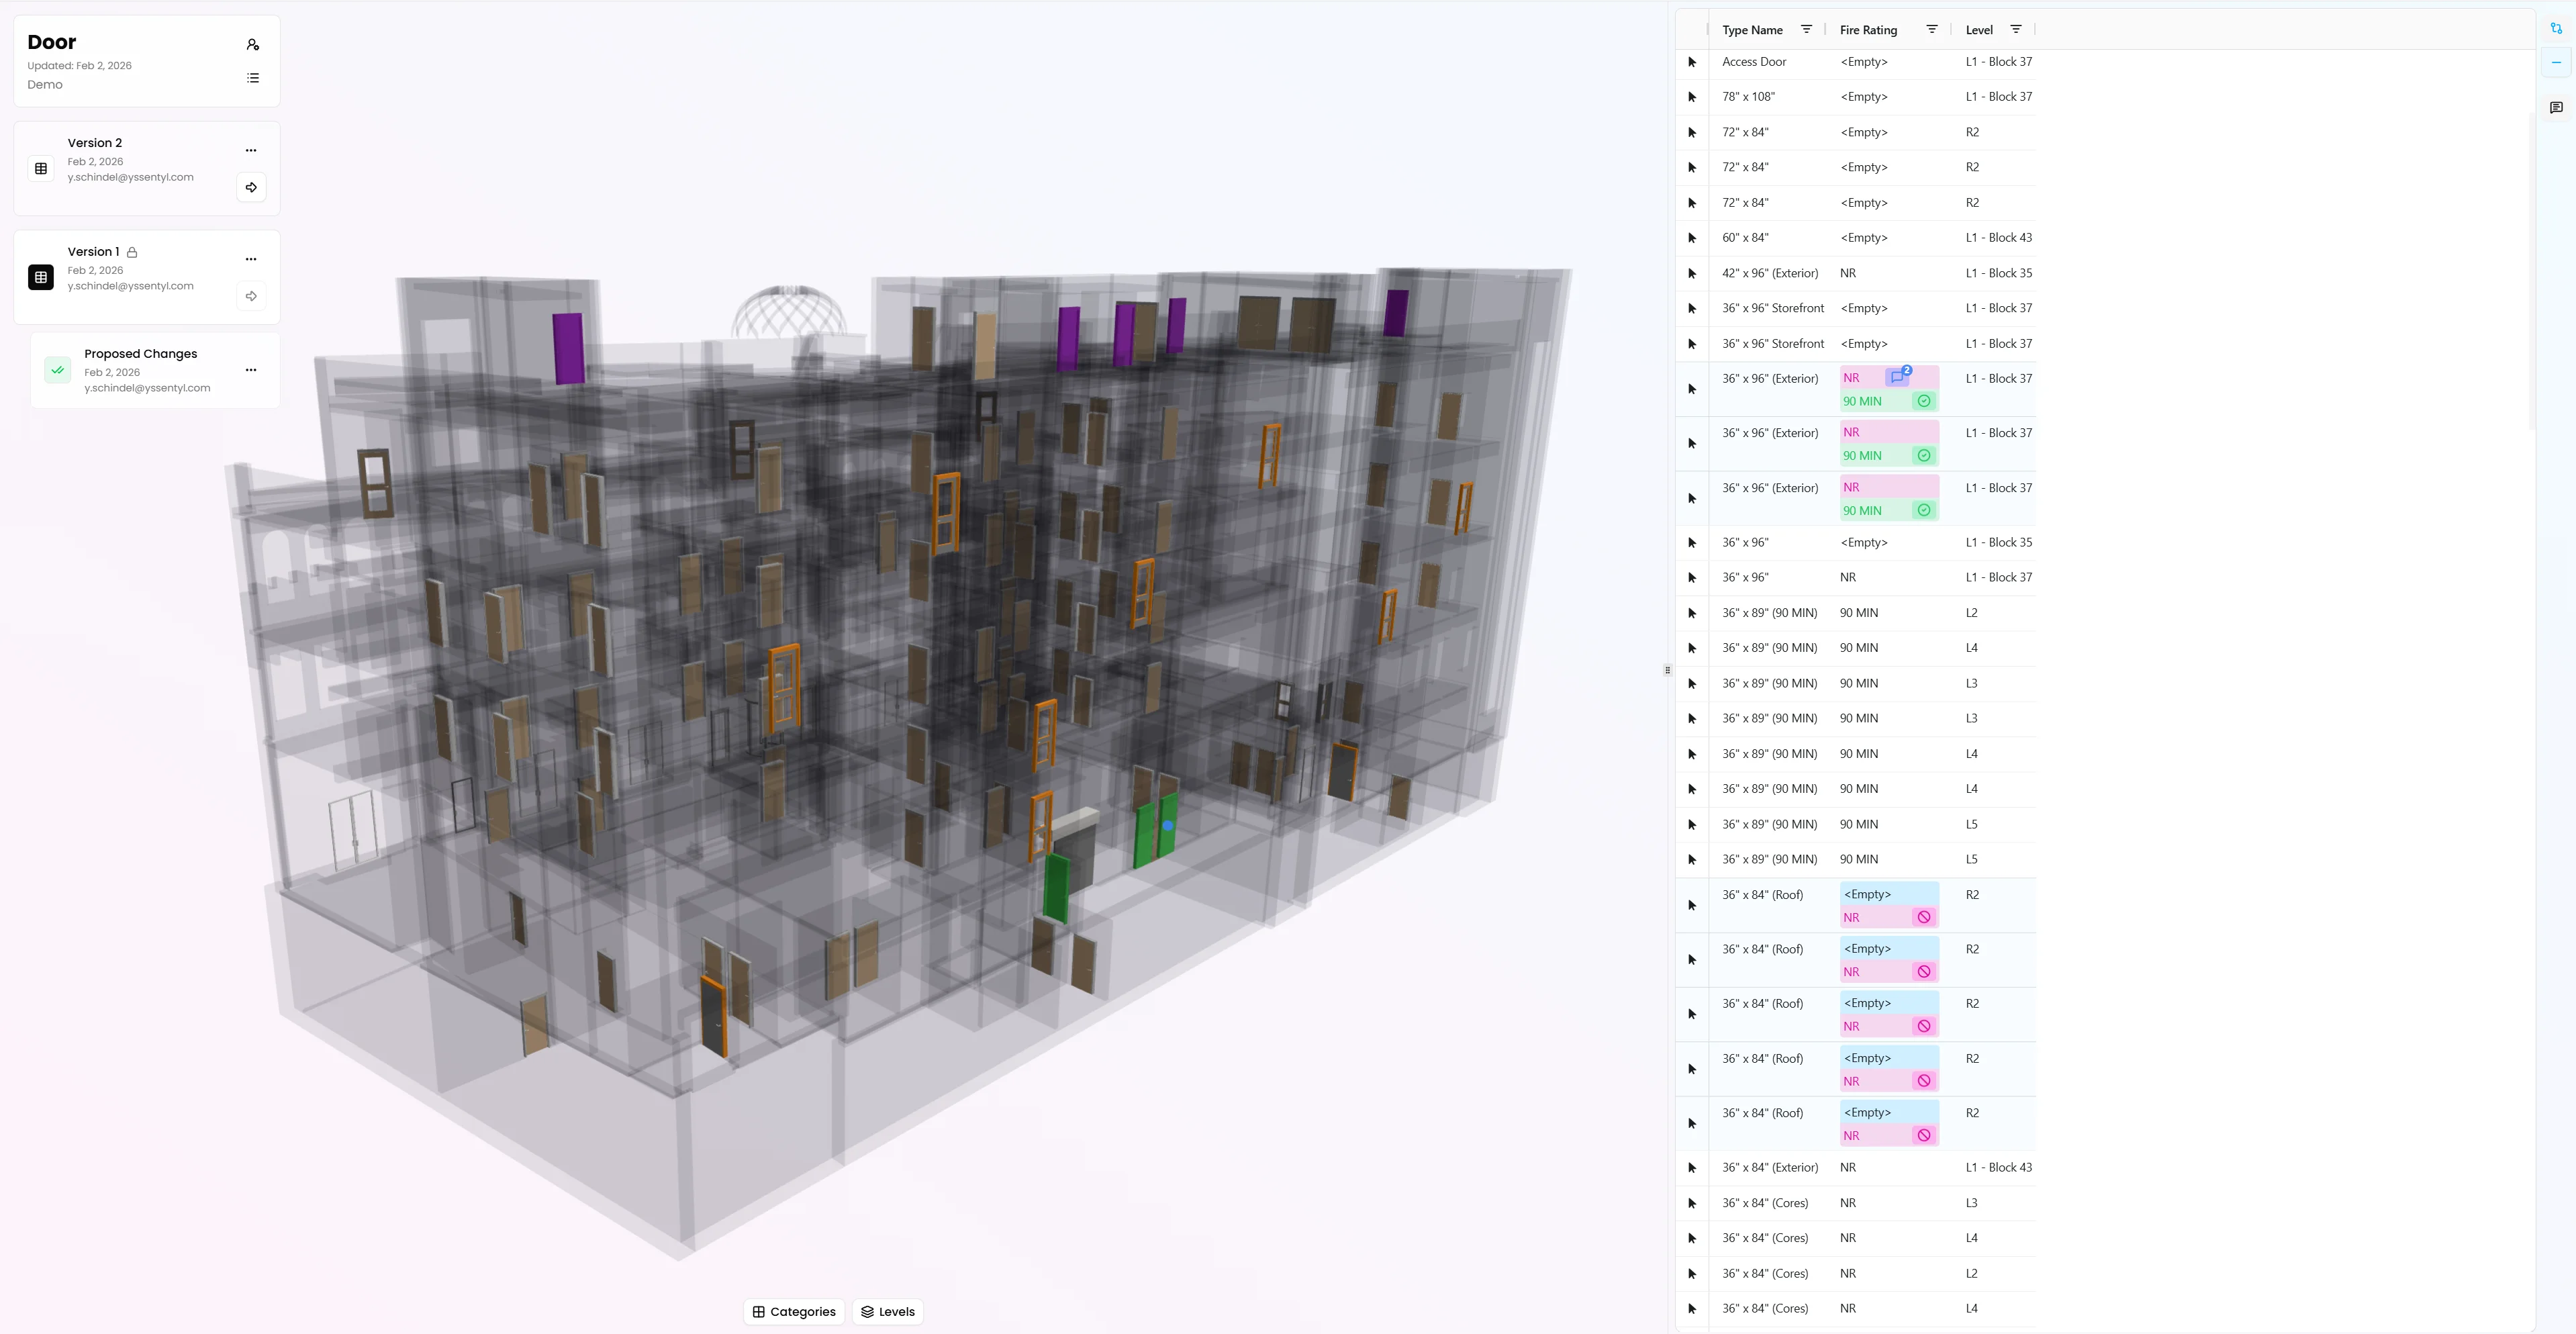
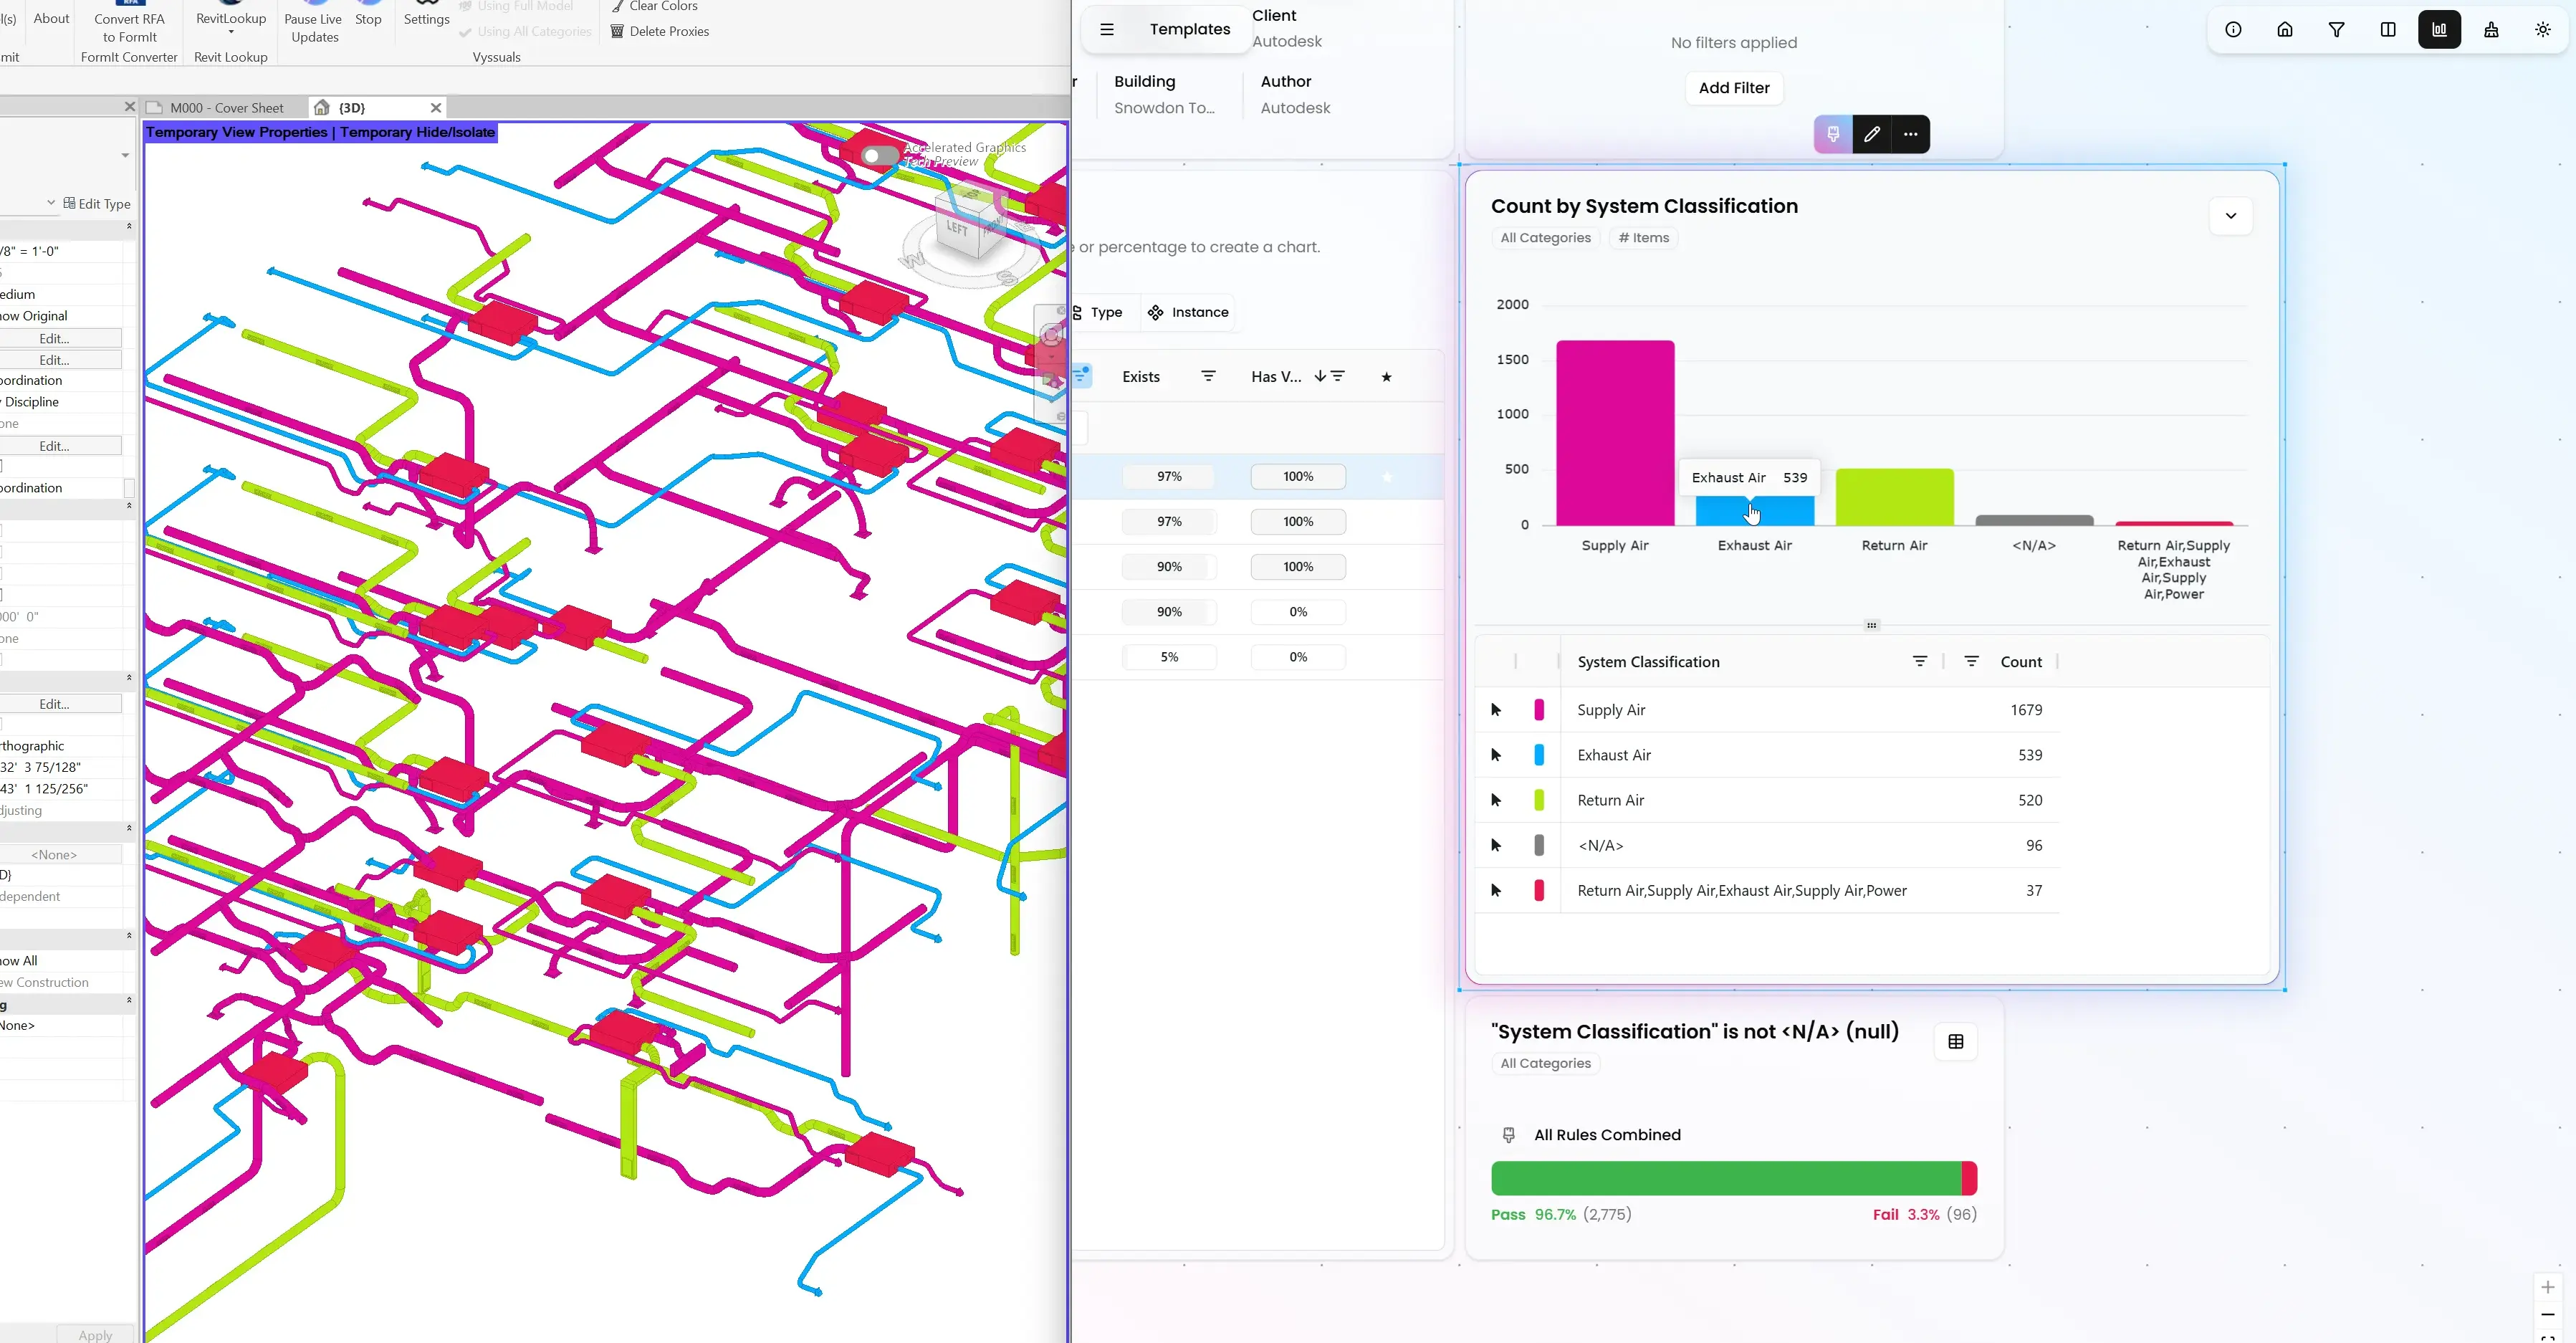
Vyssuals is a data-first BIM workspace for teams working with Revit and IFC to visualize, validate, and automate model data workflows in real time. Build charts and 3D views, catch missing or inconsistent values, and run controlled automations with approval before changes are applied.
Primary Function
Review & CoordinationSpecialization
Digital Specification ReviewBest For
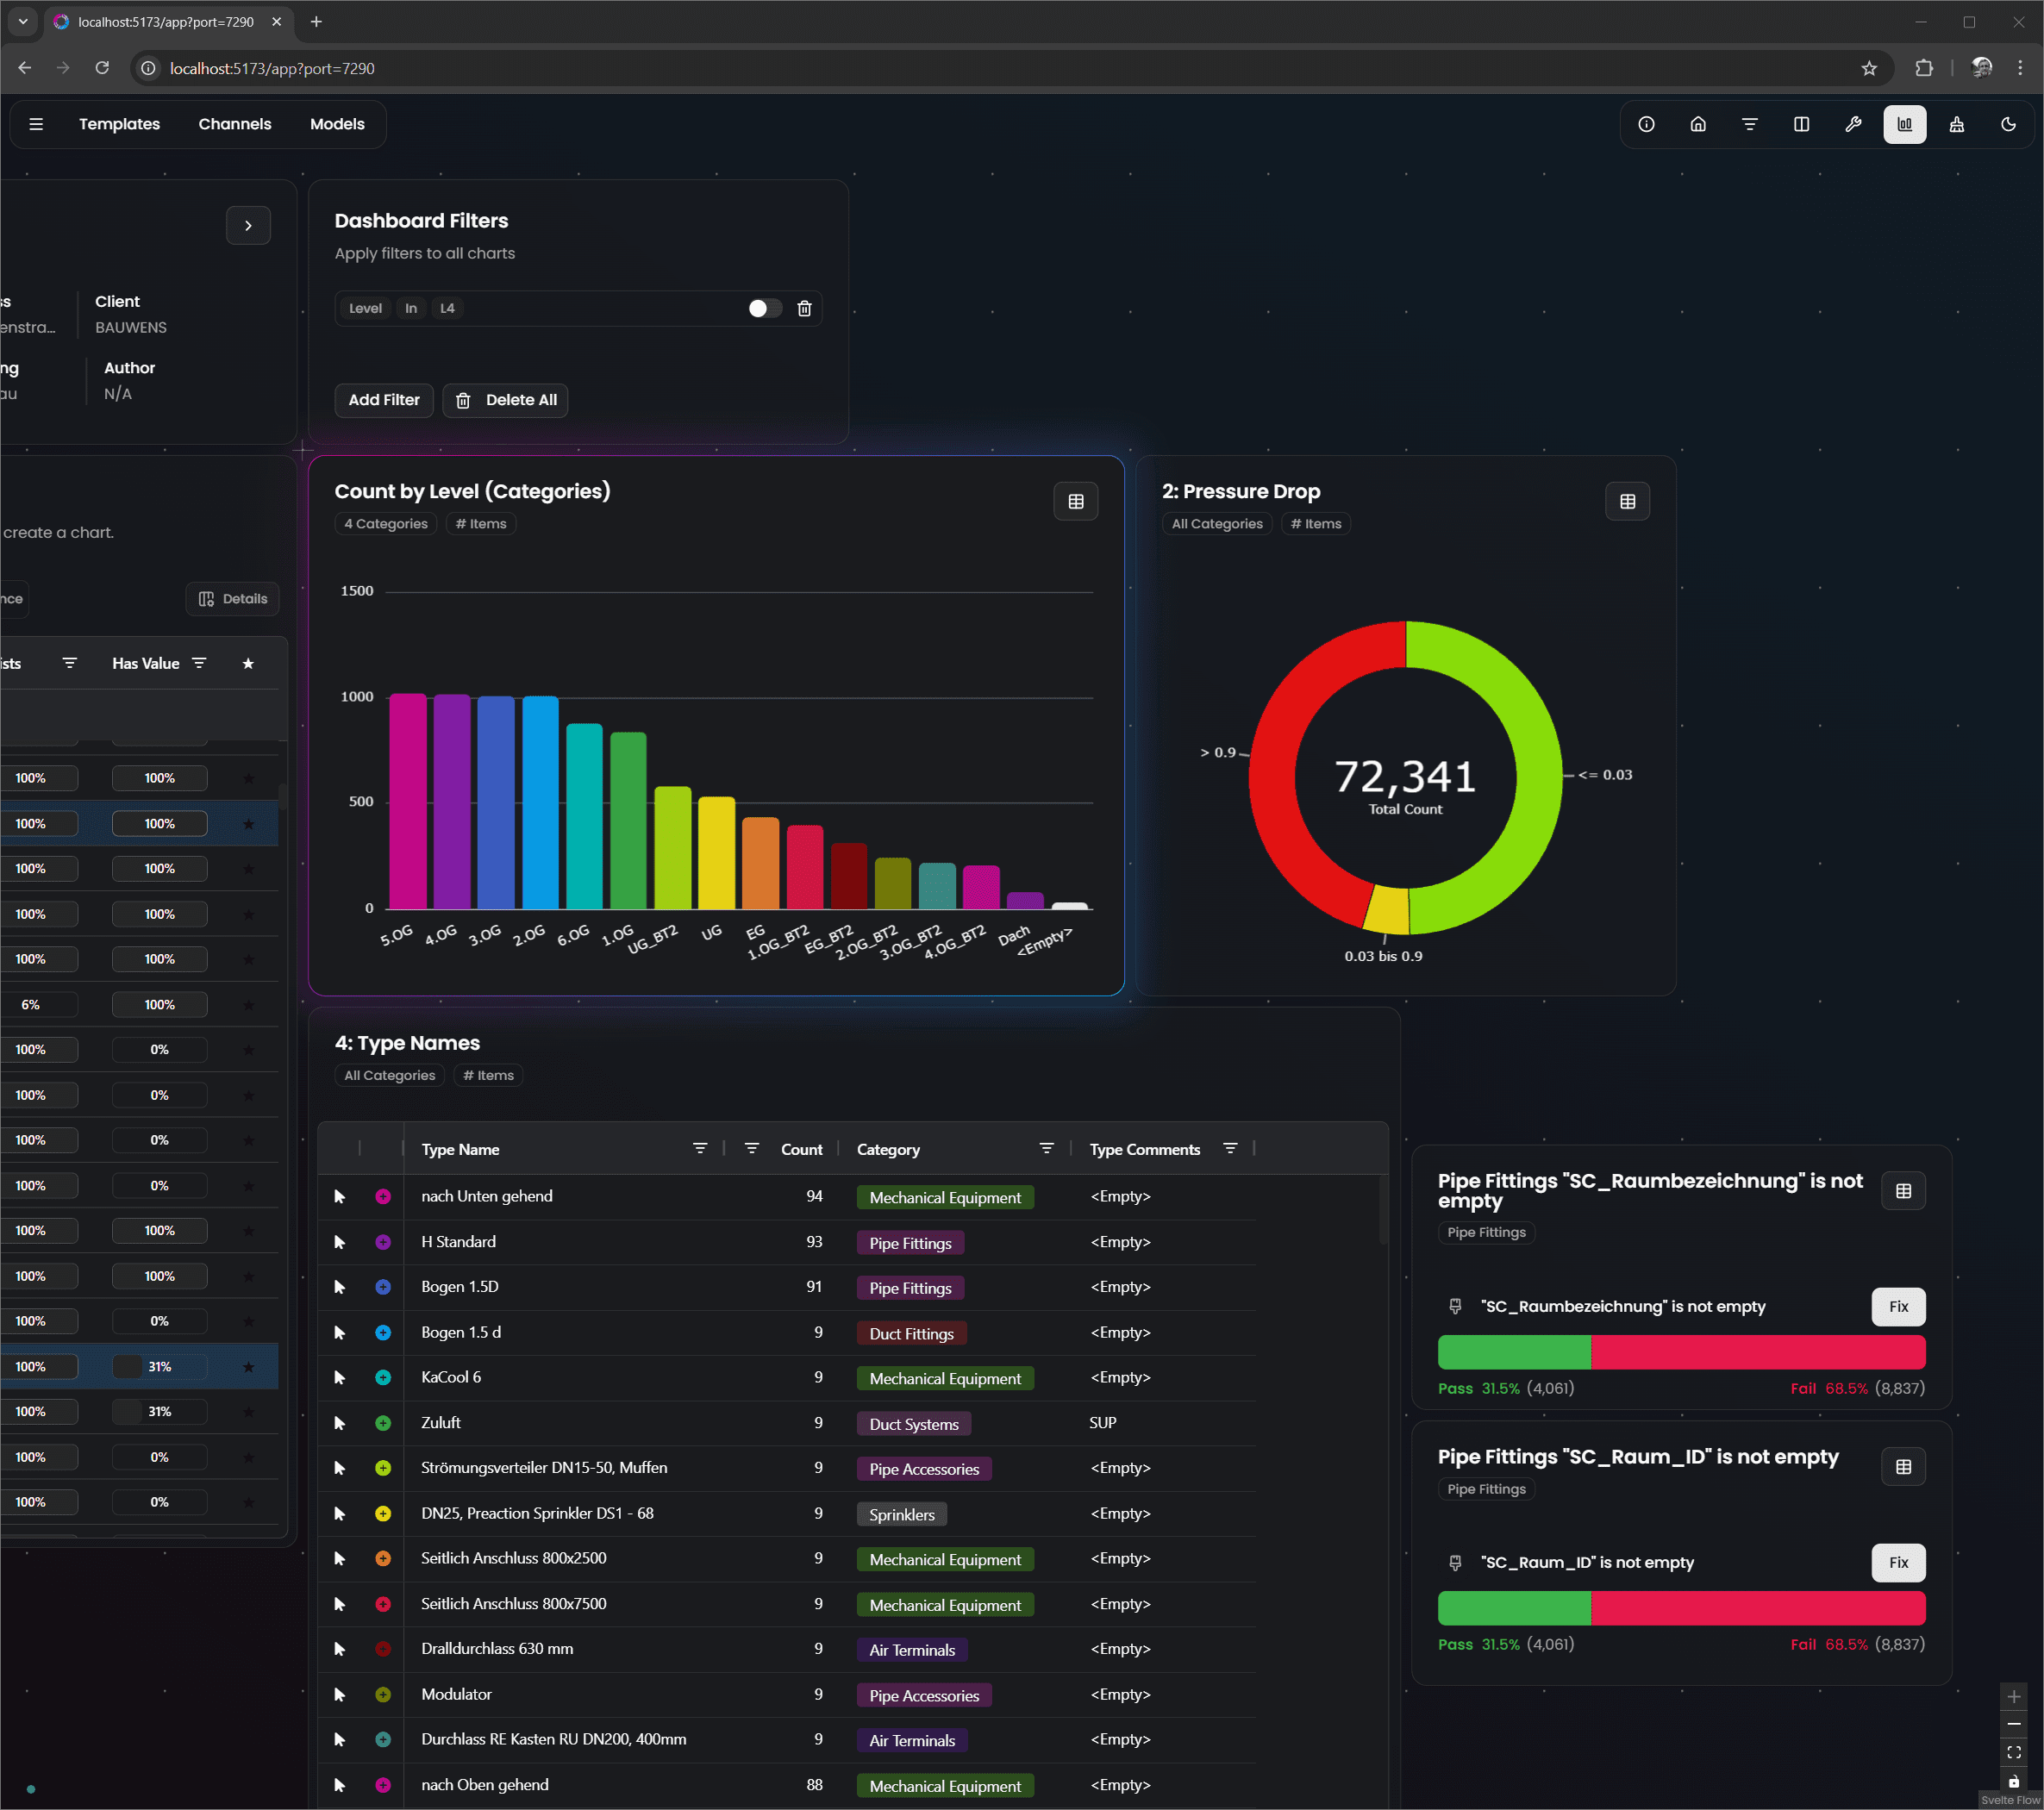
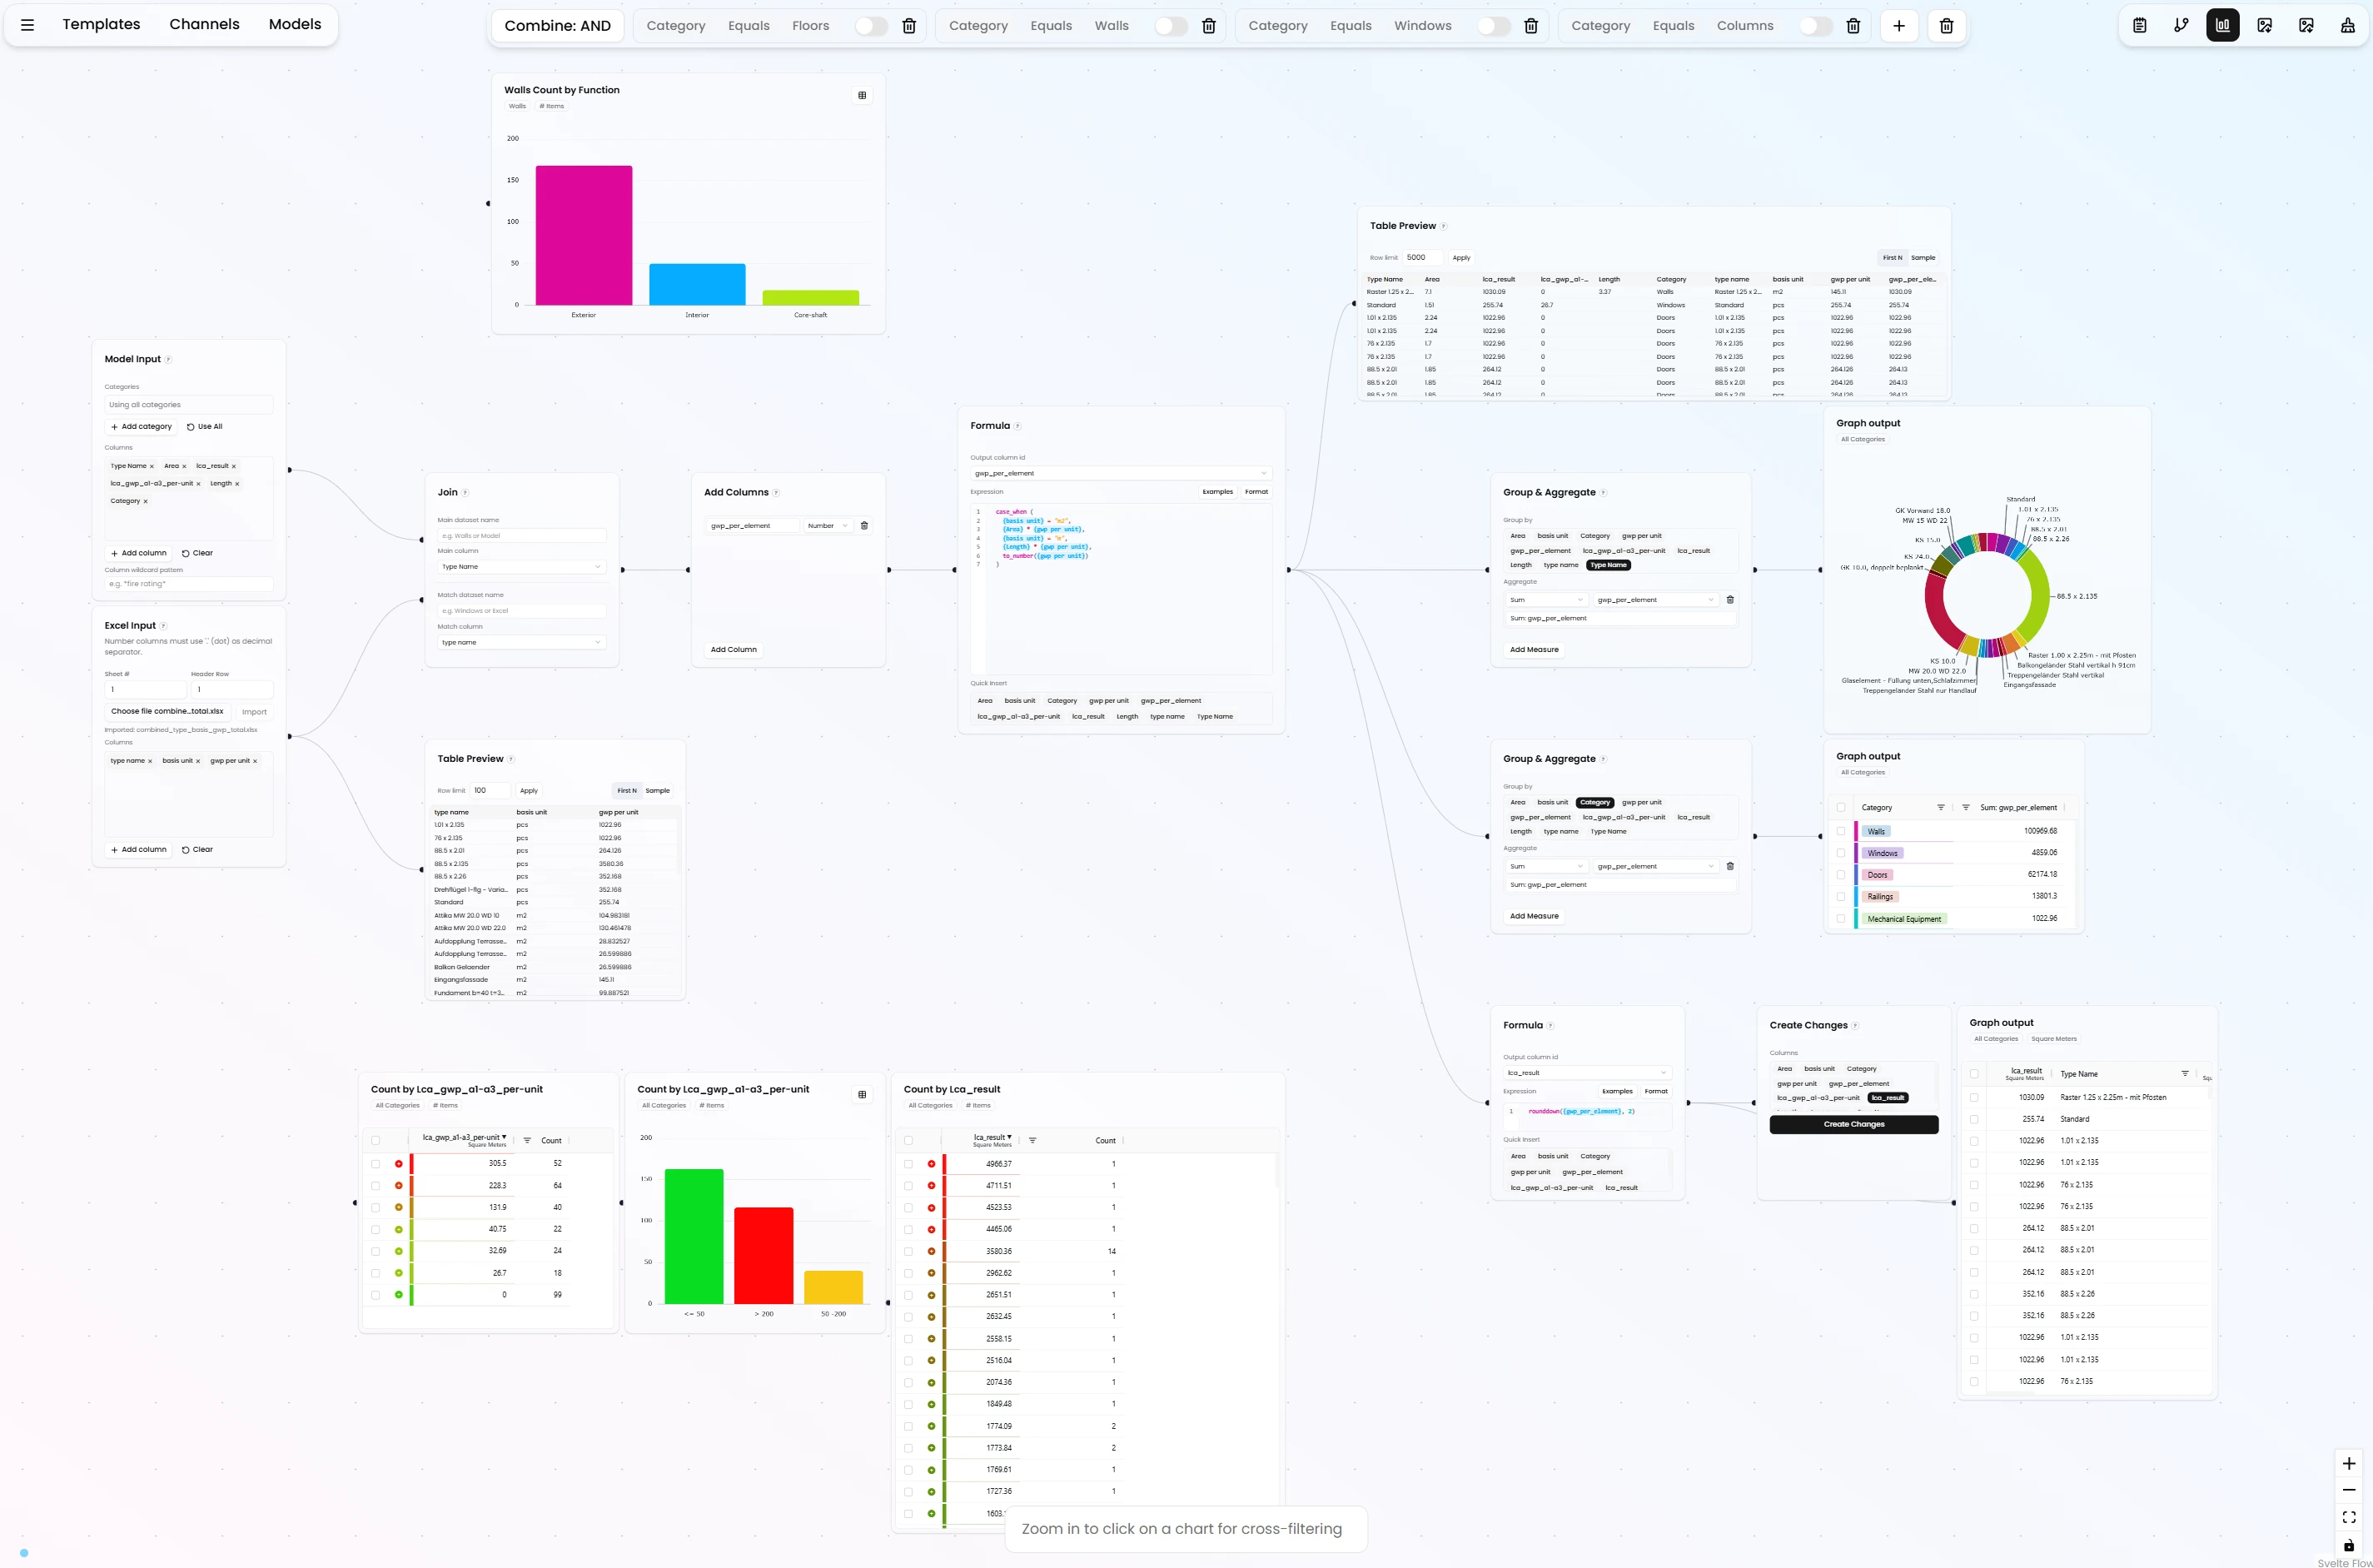
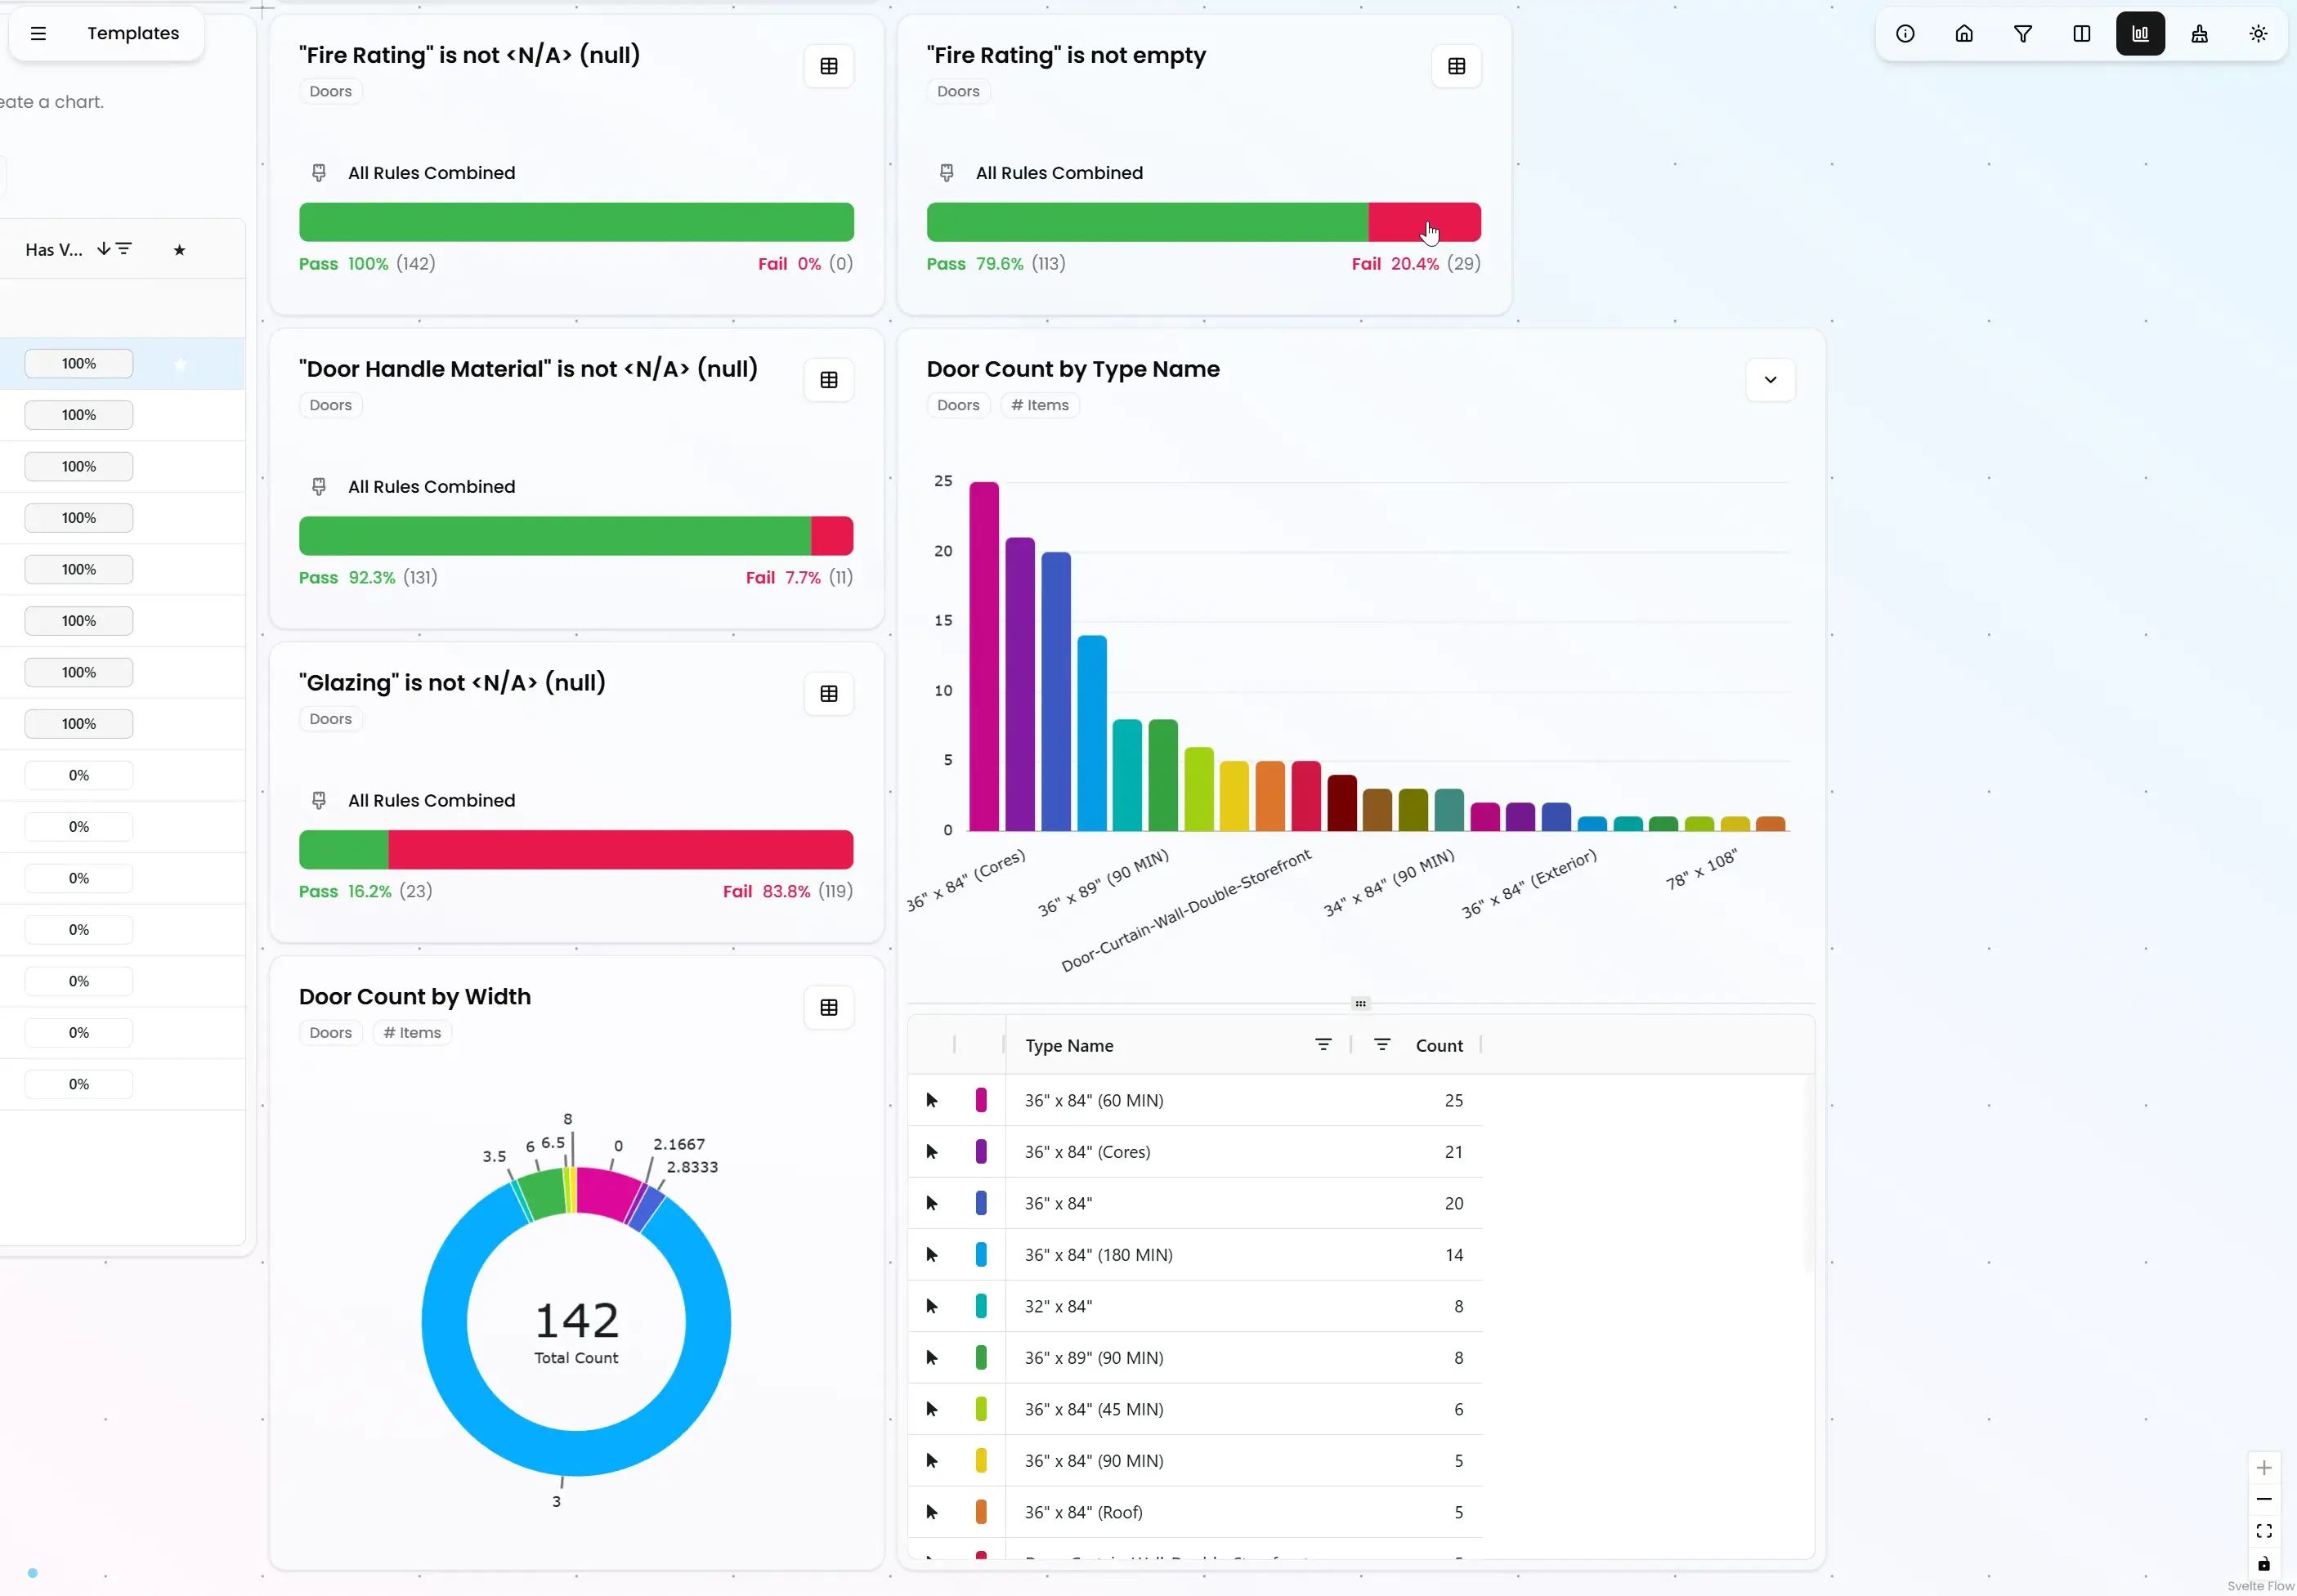
Vyssuals helps architecture, engineering, and BIM teams turn Revit and IFC data into a live decision workspace instead of static exports. Teams can analyze model information in real time, filter and drill down by parameter, and instantly see results in 3D, charts and tables. A core strength of Vyssuals is automation with control. Teams can use rule-based checks, model health workflows, and Node Graph automations to standardize repetitive data tasks such as filtering, transforming, validating, and preparing handoff-ready data. Diff-aware previews and approval gates keep humans in control, so automations improve speed without introducing blind risk. Vyssuals also improves collaboration across disciplines. Shared Dashboards let stakeholders review charts and 3D model context in the browser, while Channels enable versioned, BIM-aware data exchange with comments and approvals, avoiding fragile Excel handoffs. For advanced users, the Graph Canvas provides reusable automation pipelines (filter, join, formula, aggregate, diff) for repeatable QA/QC and pre-export workflows across both Revit and IFC use cases. In short, Vyssuals combines BIM data management, quality control, and practical automation so teams can reduce rework, increase trust in model data, and deliver cleaner information faster.
Build reusable, visual data workflows for Revit and IFC models using nodes for filtering, joining, formulas, aggregation, and diffing. Automate repetitive BIM data tasks without relying on fragile one-off scripts.
Define and run data quality checks to catch missing, inconsistent, or non-compliant values early. Turn QA/QC from late-stage cleanup into a repeatable workflow throughout the project lifecycle.
No Related Posts Yet
Posts that mention or use this tool will appear here.
Sign in to leave a comment and help other users discover great tools.
Access
SubscriptionProject Phases:
Design (SD → DD → CD) → Operation & Maintenance
Project Types:
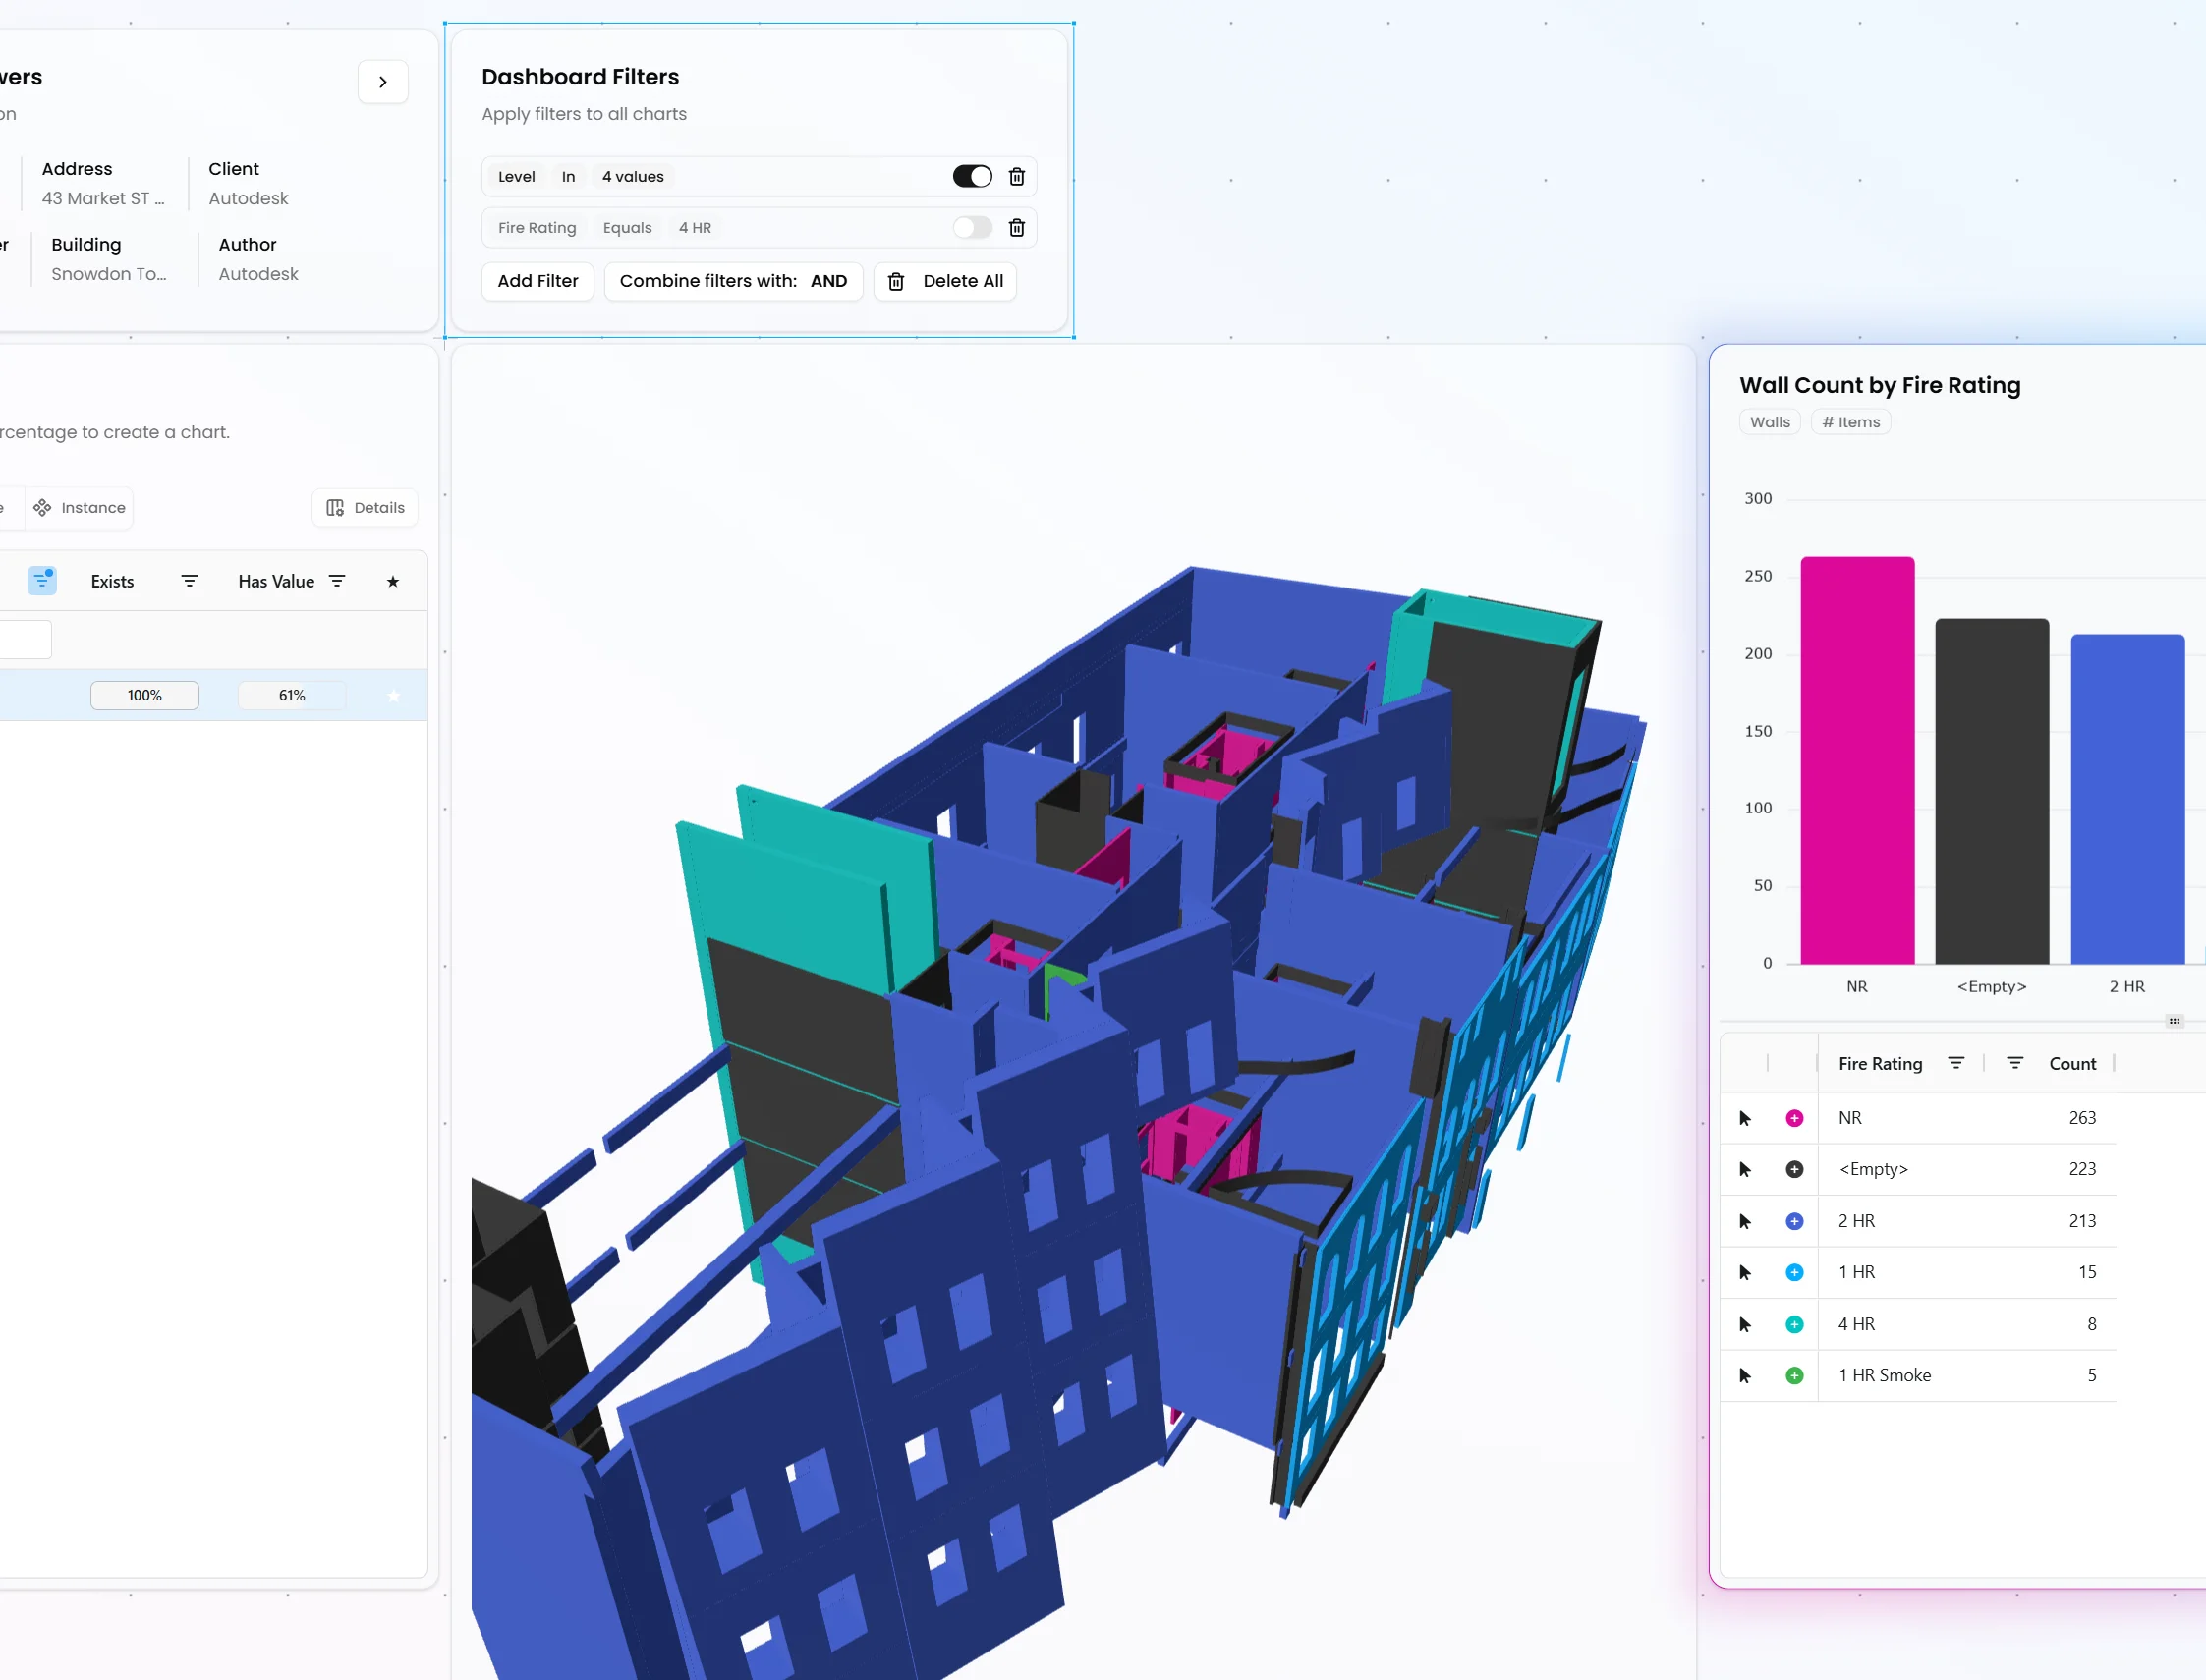
Use interactive charts and tables to explore, segment, and validate model data from both Revit and IFC. Quickly spot anomalies, compare distributions, and drill into underlying elements before issues reach downstream teams.
Share interactive dashboards with charts, filters, and 3D context so stakeholders can validate model data in the browser. This makes coordination faster and reduces dependence on static exports and screenshots.
Run structured, versioned data exchanges with comments and approvals instead of error-prone Excel handoffs. Preserve BIM logic like type vs instance behavior so updates stay reliable across teams.